
Page 96 - ΝΑΥΤΙΚΑ ΧΡΟΝΙΚΑ - SEPT 2025
P. 96
Annual research
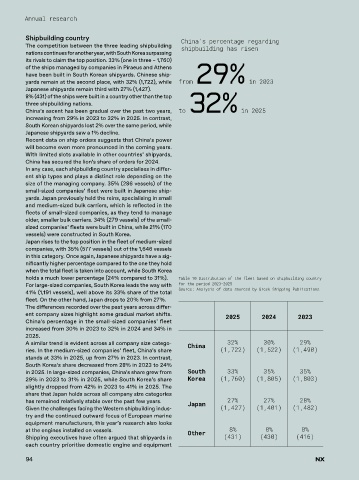
Shipbuilding country China's percentage regarding
The competition between the three leading shipbuilding shipbuilding has risen
nations continues for another year, with South Korea surpassing
its rivals to claim the top position. 33% (one in three – 1,760)
of the ships managed by companies in Piraeus and Athens
have been built in South Korean shipyards. Chinese ship-
yards remain at the second place, with 32% (1,722), while from 29% in 2023
Japanese shipyards remain third with 27% (1,427).
8% (431) of the ships were built in a country other than the top
three shipbuilding nations.
China’s ascent has been gradual over the past two years, to 32% in 2025
increasing from 29% in 2023 to 32% in 2025. In contrast,
South Korean shipyards lost 2% over the same period, while
Japanese shipyards saw a 1% decline.
Recent data on ship orders suggests that China’s power
will become even more pronounced in the coming years.
With limited slots available in other countries’ shipyards,
China has secured the lion’s share of orders for 2024.
In any case, each shipbuilding country specialises in differ-
ent ship types and plays a distinct role depending on the
size of the managing company. 35% (286 vessels) of the
small-sized companies’ fleet were built in Japanese ship-
yards. Japan previously held the reins, specialising in small
and medium-sized bulk carriers, which is reflected in the
fleets of small-sized companies, as they tend to manage
older, smaller bulk carriers. 34% (279 vessels) of the small-
sized companies’ fleets were built in China, while 21% (170
vessels) were constructed in South Korea.
Japan rises to the top position in the fleet of medium-sized
companies, with 35% (577 vessels) out of the 1,646 vessels
in this category. Once again, Japanese shipyards have a sig-
nificantly higher percentage compared to the one they hold
when the total fleet is taken into account, while South Korea
holds a much lower percentage (24% compared to 31%). Table 10 Distribution of the fleet based on shipbuilding country
For large-sized companies, South Korea leads the way with for the period 2023-2025
41% (1,191 vessels), well above its 33% share of the total Source: Analysis of data sourced by Greek Shipping Publications
fleet. On the other hand, Japan drops to 20% from 27%.
The differences recorded over the past years across differ-
ent company sizes highlight some gradual market shifts. 2025 2024 2023
China’s percentage in the small-sized companies’ fleet
increased from 30% in 2023 to 32% in 2024 and 34% in
2025.
A similar trend is evident across all company size catego- China 32% 30% 29%
ries. In the medium-sized companies’ fleet, China’s share (1,722) (1,522) (1,490)
stands at 33% in 2025, up from 27% in 2023. In contrast,
South Korea’s share decreased from 28% in 2023 to 24%
in 2025. In large-sized companies, China’s share grew from South 33% 35% 35%
29% in 2023 to 31% in 2025, while South Korea’s share Korea (1,760) (1,805) (1,803)
slightly dropped from 42% in 2023 to 41% in 2025. The
share that Japan holds across all company size categories
has remained relatively stable over the past few years. Japan 27% 27% 28%
Given the challenges facing the Western shipbuilding indus- (1,427) (1,401) (1,482)
try and the continued outward focus of European marine
equipment manufacturers, this year’s research also looks
at the engines installed on vessels. Other 8% 8% 8%
Shipping executives have often argued that shipyards in (431) (430) (416)
each country prioritise domestic engine and equipment
94 NX