
Page 97 - ΝΑΥΤΙΚΑ ΧΡΟΝΙΚΑ - SEPT 2025
P. 97
Sponsored by
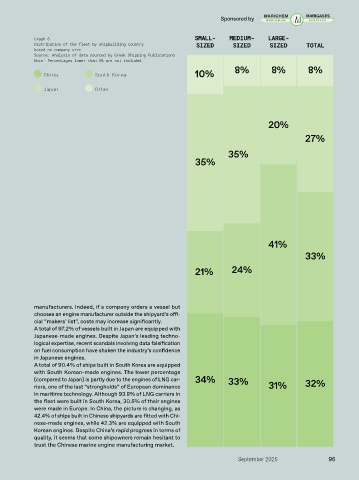
Graph 6 SMALL- MEDIUM- LARGE-
Distribution of the fleet by shipbuilding country SIZED SIZED SIZED TOTAL
based on company size
Source: Analysis of data sourced by Greek Shipping Publications
Note: Percentages lower than 5% are not included.
China South Korea 10% 8% 8% 8%
Japan Other
20%
27%
35%
35%
41%
33%
21% 24%
manufacturers. Indeed, if a company orders a vessel but
chooses an engine manufacturer outside the shipyard’s offi-
cial “makers’ list”, costs may increase significantly.
A total of 97.2% of vessels built in Japan are equipped with
Japanese-made engines. Despite Japan’s leading techno-
logical expertise, recent scandals involving data falsification
on fuel consumption have shaken the industry’s confidence
in Japanese engines.
A total of 90.4% of ships built in South Korea are equipped
with South Korean-made engines. The lower percentage
(compared to Japan) is partly due to the engines of LNG car- 34% 33% 32%
riers, one of the last “strongholds” of European dominance 31%
in maritime technology. Although 93.8% of LNG carriers in
the fleet were built in South Korea, 30.5% of their engines
were made in Europe. In China, the picture is changing, as
42.4% of ships built in Chinese shipyards are fitted with Chi-
nese-made engines, while 42.3% are equipped with South
Korean engines. Despite China’s rapid progress in terms of
quality, it seems that some shipowners remain hesitant to
trust the Chinese marine engine manufacturing market.
September 2025 95