
Page 91 - ΝΑΥΤΙΚΑ ΧΡΟΝΙΚΑ - SEPT 2025
P. 91
Sponsored by
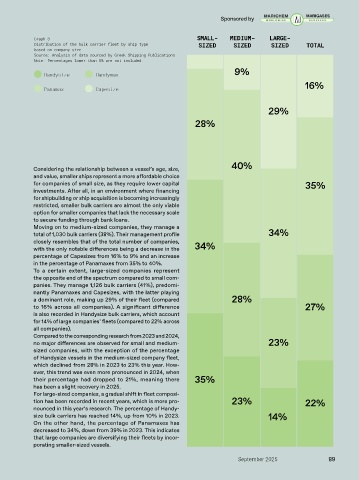
Graph 3 SMALL- MEDIUM- LARGE-
Distribution of the bulk carrier fleet by ship type SIZED SIZED SIZED TOTAL
based on company size
Source: Analysis of data sourced by Greek Shipping Publications
Note: Percentages lower than 5% are not included.
9%
Handysize Handymax
16%
Panamax Capesize
29%
28%
40%
Considering the relationship between a vessel’s age, size,
and value, smaller ships represent a more affordable choice
for companies of small size, as they require lower capital 35%
investments. After all, in an environment where financing
for shipbuilding or ship acquisition is becoming increasingly
restricted, smaller bulk carriers are almost the only viable
option for smaller companies that lack the necessary scale
to secure funding through bank loans.
Moving on to medium-sized companies, they manage a
total of 1,030 bulk carriers (38%). Their management profile 34%
closely resembles that of the total number of companies,
with the only notable differences being a decrease in the 34%
percentage of Capesizes from 16% to 9% and an increase
in the percentage of Panamaxes from 35% to 40%.
To a certain extent, large-sized companies represent
the opposite end of the spectrum compared to small com-
panies. They manage 1,126 bulk carriers (41%), predomi-
nantly Panamaxes and Capesizes, with the latter playing
a dominant role, making up 29% of their fleet (compared 28%
to 16% across all companies). A significant difference 27%
is also recorded in Handysize bulk carriers, which account
for 14% of large companies’ fleets (compared to 22% across
all companies).
Compared to the corresponding research from 2023 and 2024,
no major differences are observed for small and medium- 23%
sized companies, with the exception of the percentage
of Handysize vessels in the medium-sized company fleet,
which declined from 28% in 2023 to 23% this year. How-
ever, this trend was even more pronounced in 2024, when
their percentage had dropped to 21%, meaning there 35%
has been a slight recovery in 2025.
For large-sized companies, a gradual shift in fleet composi-
tion has been recorded in recent years, which is more pro- 23% 22%
nounced in this year’s research. The percentage of Handy-
size bulk carriers has reached 14%, up from 10% in 2023. 14%
On the other hand, the percentage of Panamaxes has
decreased to 34%, down from 39% in 2023. This indicates
that large companies are diversifying their fleets by incor-
porating smaller-sized vessels.
September 2025 89