
Page 81 - ΝΑΥΤΙΚΑ ΧΡΟΝΙΚΑ - SEPT 2025
P. 81
Sponsored by
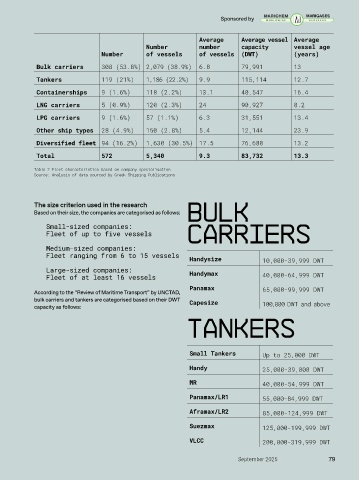
Average Average vessel Average
Number number capacity vessel age
Number of vessels of vessels (DWT) (years)
Bulk carriers 308 (53.8%) 2,079 (38.9%) 6.8 79,991 13
Tankers 119 (21%) 1,186 (22.2%) 9.9 115,114 12.7
Containerships 9 (1.6%) 118 (2.2%) 13.1 40,547 16.4
LNG carriers 5 (0.9%) 120 (2.3%) 24 90,927 8.2
LPG carriers 9 (1.6%) 57 (1.1%) 6.3 31,551 13.4
Other ship types 28 (4.9%) 150 (2.8%) 5.4 12,144 23.9
Diversified fleet 94 (16.2%) 1,630 (30.5%) 17.5 76,680 13.2
Total 572 5,340 9.3 83,732 13.3
Table 2 Fleet characteristics based on company specialisation
Source: Analysis of data sourced by Greek Shipping Publications
The size criterion used in the research
Based on their size, the companies are categorised as follows: Bulk
Small-sized companies:
Fleet of up to five vessels Carriers
Medium-sized companies:
Fleet ranging from 6 to 15 vessels Handysize 10,000-39,999 DWT
Large-sized companies: Handymax
Fleet of at least 16 vessels 40,000-64,999 DWT
Panamax
According to the “Review of Maritime Transport” by UNCTAD, 65,000-99,999 DWT
bulk carriers and tankers are categorised based on their DWT Capesize
capacity as follows: 100,000 DWT and above
Tankers
Small Tankers Up to 25,000 DWT
Handy 25,000-39,000 DWT
MR 40,000-54,999 DWT
Panamax/LR1 55,000-84,999 DWT
Aframax/LR2 85,000-124,999 DWT
Suezmax 125,000-199,999 DWT
VLCC 200,000-319,999 DWT
September 2025 79