
Page 80 - ΝΑΥΤΙΚΑ ΧΡΟΝΙΚΑ - SEPT 2025
P. 80
Annual research
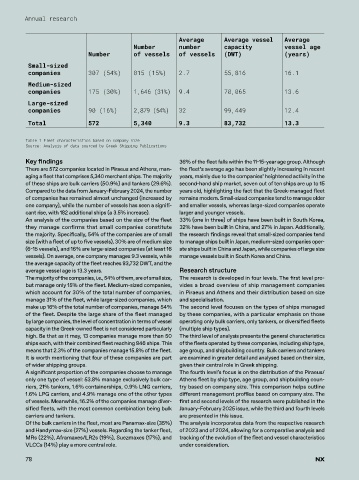
Average Average vessel Average
Number number capacity vessel age
Number of vessels of vessels (DWT) (years)
Small-sized
companies 307 (54%) 815 (15%) 2.7 55,816 16.1
Medium-sized
companies 175 (30%) 1,646 (31%) 9.4 70,065 13.6
Large-sized
companies 90 (16%) 2,879 (54%) 32 99,449 12.4
Total 572 5,340 9.3 83,732 13.3
Table 1 Fleet characteristics based on company size
Source: Analysis of data sourced by Greek Shipping Publications
Key findings 36% of the fleet falls within the 11-15-year age group. Although
There are 572 companies located in Piraeus and Athens, man- the fleet’s average age has been slightly increasing in recent
aging a fleet that comprises 5,340 merchant ships. The majority years, mainly due to the companies’ heightened activity in the
of these ships are bulk carriers (50.9%) and tankers (29.6%). second-hand ship market, seven out of ten ships are up to 15
Compared to the data from January-February 2024, the number years old, highlighting the fact that the Greek-managed fleet
of companies has remained almost unchanged (increased by remains modern. Small-sized companies tend to manage older
one company), while the number of vessels has seen a signifi- and smaller vessels, whereas large-sized companies operate
cant rise, with 182 additional ships (a 3.5% increase). larger and younger vessels.
An analysis of the companies based on the size of the fleet 33% (one in three) of ships have been built in South Korea,
they manage confirms that small companies constitute 32% have been built in China, and 27% in Japan. Additionally,
the majority. Specifically, 54% of the companies are of small the research findings reveal that small-sized companies tend
size (with a fleet of up to five vessels), 30% are of medium size to manage ships built in Japan, medium-sized companies oper-
(6-15 vessels), and 16% are large-sized companies (at least 16 ate ships built in China and Japan, while companies of large size
vessels). On average, one company manages 9.3 vessels, while manage vessels built in South Korea and China.
the average capacity of the fleet reaches 83,732 DWT, and the
average vessel age is 13.3 years. Research structure
The majority of the companies, i.e., 54% of them, are of small size, The research is developed in four levels. The first level pro-
but manage only 15% of the fleet. Medium-sized companies, vides a broad overview of ship management companies
which account for 30% of the total number of companies, in Piraeus and Athens and their distribution based on size
manage 31% of the fleet, while large-sized companies, which and specialisation.
make up 16% of the total number of companies, manage 54% The second level focuses on the types of ships managed
of the fleet. Despite the large share of the fleet managed by these companies, with a particular emphasis on those
by large companies, the level of concentration in terms of vessel operating only bulk carriers, only tankers, or diversified fleets
capacity in the Greek-owned fleet is not considered particularly (multiple ship types).
high. Be that as it may, 13 companies manage more than 50 The third level of analysis presents the general characteristics
ships each, with their combined fleet reaching 846 ships. This of the fleets operated by these companies, including ship type,
means that 2.3% of the companies manage 15.8% of the fleet. age group, and shipbuilding country. Bulk carriers and tankers
It is worth mentioning that four of these companies are part are examined in greater detail and analysed based on their size,
of wider shipping groups. given their central role in Greek shipping.
A significant proportion of the companies choose to manage The fourth level’s focus is on the distribution of the Piraeus/
only one type of vessel: 53.8% manage exclusively bulk car- Athens fleet by ship type, age group, and shipbuilding coun-
riers, 21% tankers, 1.6% containerships, 0.9% LNG carriers, try based on company size. This comparison helps outline
1.6% LPG carriers, and 4.9% manage one of the other types different management profiles based on company size. The
of vessels. Meanwhile, 16.2% of the companies manage diver- first and second levels of the research were published in the
sified fleets, with the most common combination being bulk January-February 2025 issue, while the third and fourth levels
carriers and tankers. are presented in this issue.
Of the bulk carriers in the fleet, most are Panamax-size (35%) The analysis incorporates data from the respective research
and Handymax-size (27%) vessels. Regarding the tanker fleet, of 2023 and of 2024, allowing for a comparative analysis and
MRs (22%), Aframaxes/LR2s (19%), Suezmaxes (17%), and tracking of the evolution of the fleet and vessel characteristics
VLCCs (14%) play a more central role. under consideration.
78 NX