
Page 88 - ΝΑΥΤΙΚΑ ΧΡΟΝΙΚΑ - ΜΑΙΟΣ 2023
P. 88
GREEN SHIPPING / RESEARCH
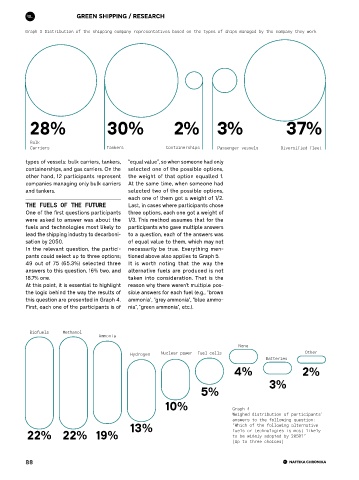
Graph 3 Distribution of the shipping company representatives based on the types of ships managed by the company they work
28% 30% 2% 3% 37%
Bulk
Carriers Tankers Containerships Passenger vessels Diversified fleet
types of vessels: bulk carriers, tankers, “equal value”, so when someone had only
containerships, and gas carriers. On the selected one of the possible options,
other hand, 12 participants represent the weight of that option equalled 1.
companies managing only bulk carriers At the same time, when someone had
and tankers. selected two of the possible options,
each one of them got a weight of 1/2.
THE FUELS OF THE FUTURE Last, in cases where participants chose
One of the first questions participants three options, each one got a weight of
were asked to answer was about the 1/3. This method assumes that for the
fuels and technologies most likely to participants who gave multiple answers
lead the shipping industry to decarboni- to a question, each of the answers was
sation by 2050. of equal value to them, which may not
In the relevant question, the partici- necessarily be true. Everything men-
pants could select up to three options; tioned above also applies to Graph 5.
49 out of 75 (65.3%) selected three It is worth noting that the way the
answers to this question, 16% two, and alternative fuels are produced is not
18.7% one. taken into consideration. That is the
At this point, it is essential to highlight reason why there weren't multiple pos-
the logic behind the way the results of sible answers for each fuel (e.g., "brown
this question are presented in Graph 4. ammonia", "grey ammonia", "blue ammo-
First, each one of the participants is of nia", "green ammonia", etc.).
Biofuels Methanol
Ammonia
None
Hydrogen Nuclear power Fuel cells Other
Batteries
4% 2%
3%
5%
10% Graph 4
Weighed distribution of participants’
answers to the following question:
13% “Which of the following alternative
22% 22% 19% fuels or technologies is most likely
to be widely adopted by 2050?”
(Up to three choices)
88