
Page 86 - ΝΑΥΤΙΚΑ ΧΡΟΝΙΚΑ - ΜΑΙΟΣ 2023
P. 86
GREEN SHIPPING / RESEARCH
by the need to reduce shipping’s envi- To facilitate comparisons based on the
ronmental footprint and to draw con- size of the shipping companies repre-
clusions about their impact on the sented in the survey, we have included
industry’s decarbonisation. Which marine two additional categories: representa-
fuels will prevail, and what technologies tives of companies with a fleet of up to
will be used to reduce fuel consump- 15 ships and representatives of compa-
tion and, ultimately, ships’ emissions? nies with a fleet of more than 15 ships. 28
We hope the responses to these and of the company representatives belong
other questions posed to the survey’s to the first category of shipping com-
participants will trigger a meaningful panies, while 32 belong to the second.
dialogue among industry stakeholders Another axis of survey participant cat-
as shipping begins its journey towards egorisation is the type of vessels their
decarbonisation. companies manage. The critical role of
bulk carriers and tankers in the Piraeus/
DISTRIBUTION OF THE SURVEY Athens fleet is again evident. Of the
PARTICIPANTS BASED ON THE survey’s 60 shipping company repre-
NUMBER AND TYPE OF SHIPS sentatives, 17 work in companies that
MANAGED BY THE COMPANY THEY exclusively manage bulk carriers and 18
REPRESENT in companies that exclusively manage
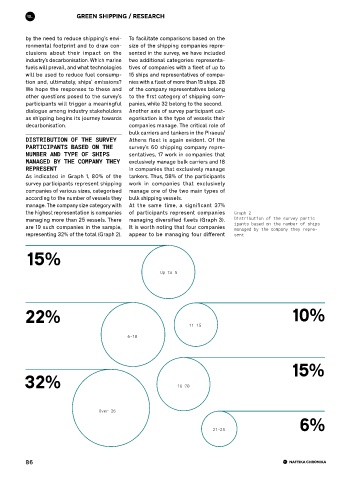
As indicated in Graph 1, 80% of the tankers. Thus, 58% of the participants
survey participants represent shipping work in companies that exclusively
companies of various sizes, categorised manage one of the two main types of
according to the number of vessels they bulk shipping vessels.
manage. The company size category with At the same time, a significant 37%
the highest representation is companies of participants represent companies Graph 2
managing more than 25 vessels. There managing diversified fleets (Graph 3). Distribution of the survey partic-
are 19 such companies in the sample, It is worth noting that four companies ipants based on the number of ships
managed by the company they repre-
representing 32% of the total (Graph 2). appear to be managing four different sent
15%
Up to 5
22% 10%
11-15
6-10
15%
32% 16-20
Over 26
6%
21-25
86